Case Study: How I Went About Optimizing My On-Prem to Cloud Copy Performance
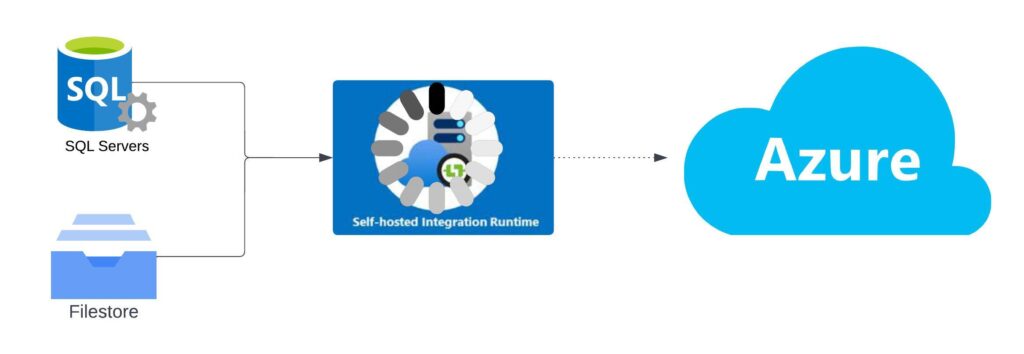
Explaining the Use Case
Not too long ago, I built out a solution where the initial component was all centered around data transfer from an On-premises SQL DB and landing that data into ADLS for further ETL processing before landing in my warehouse. The first part of the ETL seemed simple enough, take data from On-Prem and land the incremental into the Data Lake leveraging Synapse Workspace’s Self Hosted Integration Runtime (SHIR). Seemed easy enough, I’ve only done it a thousand times before
A few good hours building out the dynamic process allowing me to incrementally pull data from my predetermined list of tables and the first part of the ETL was done. There I was, finally all wrapped up with my complex integration – ready to get this build up into production. I deploy the solution to the Test environment to check for Processing impacts and boom…the data transfer is spinning for over an hour and it’s still not done.
As I sat back and thought about what made this integration different from those I’d done before, there was one glaring difference. The volume of Data for this solution was WAY bigger than solutions I’d built in the past. Even with incremental pulls running hourly to pull in changed records, I was looking at pulling through tens of millions of records through my integration pipeline.
Determined to figure out what I could change to improve throughput and account for large data volume, I turned to my old friend Google and started digging.
In this post, I want to walk you through my process of optimizing On-Prem to Cloud data transfer in Azure Data Factory and Synapse Analytics to explain how these infrastructure components work and how they can be optimized for scale in production environments. In this post my goal is to outline the following information related to the Self Hosted Integration Runtime (SHIR) configuration to create a gateway from cloud resources to the on-premises data stores and outline/explain the following topics:
- Reasoning for scale and purpose of testing SHIR configuration along with detailed overview of SHIR purpose and use case.
- Scaling options and Microsoft design recommendations for this piece of infrastructure.
- Infrastructure Testing Methodology I utilized to determine optimal setup.
- Testing criteria overview and how performance was be measured both for Pipeline performance as well as the infrastructure side.
- What my findings were when toying around with the parameters in this kind of integration pattern.
SHIR Overview and Its Role in ETL Architecture
Per Microsoft documentation, SHIRs enable the following functionality in an Integration workflow:
- self-hosted integration runtime can run copy activities between a cloud data store and a data store in a private network.
- dispatch transform activities against compute resources in an on-premises network or an Azure virtual network.
For my use case, the primary use case for this type of design is to migrate on-premises data into the Data Lake or directly into EDW tables for data consolidation for reporting data stores:
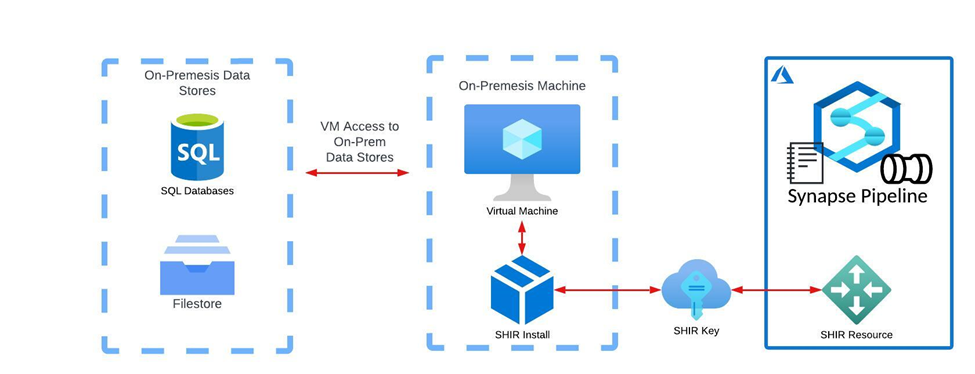
- SHIR is a built-in resource in Azure Data Factory and Azure Synapse that can be configured based on need in any given workspace.
- Upon generating an SHIR resource a user is provided with an installation package and a unique key to the given workspace that the SHIR was configured in.
- This installation package is placed onto a Virtual Machine living on the on-premises network and linked to the relevant Azure Environment by the SHIR Key provided upon resource configuration.
- The local VM gives access to the relevant Data Sources that live on-premises.
- Via the gateway that has been created with this design, Azure commands such as code execution, copy data requests, etc. are ran on the local machine to interact with local data stores.
SHIR at Scale Design
After taking a look at the processing monitor in Synapse – I was able to identify that the Copy Data activities were definitely the bottleneck to my overall process. Under my initial design, the SHIR was installed on a relatively small single node VM. No wonder my process was running slow 🙂
My next question was, how do I make the copy data activities more performant…luckily Microsoft has great documentation on this topic!
According to the below diagram from Microsoft Documentation, SHIRs can support up to 4nodes (VMs) as connection to the on-premises all of which can be scaled up or down in compute for better concurrency and performance.
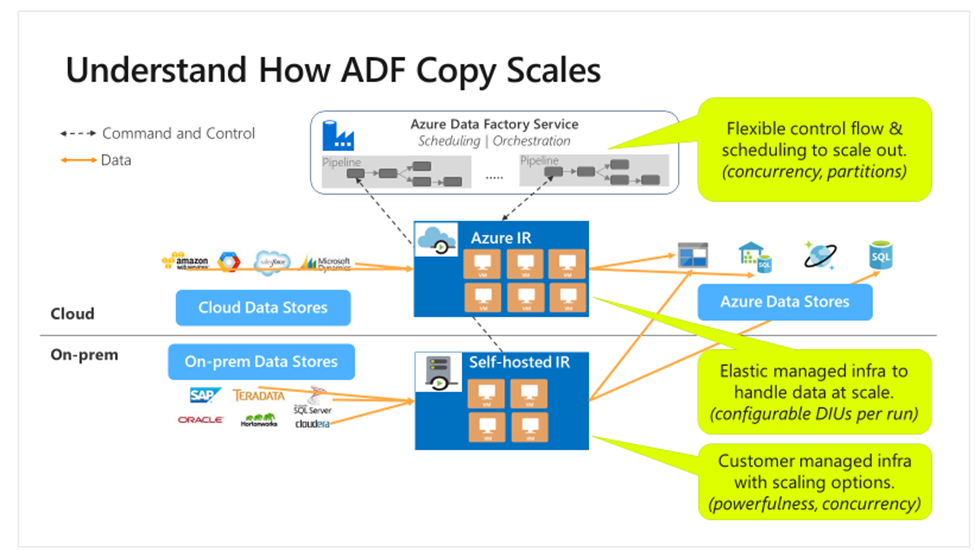
With larger scale infrastructure setup, SHIR based pipelines are optimized in the following ways:
- Higher availability of the self-hosted integration runtime so that it’s no longer the single point of failure in big data solutions or cloud data integration. This availability helps ensure continuity when you use up to four nodes.
- Improved performance and throughput during data movement between on-premises and cloud data stores.
There are 2 ways in which one can scale their SHIR:
Scale Out
Per Microsoft documentation, “When processor usage is high and available memory is low on the self-hosted IR, add a new node to help scale out the load across machines. If activities fail because they time out or the self-hosted IR node is offline, it helps if admins add a node to the gateway.”
Essentially, the Scale Out option means adding another VM in association with the SHIR gateway, to share the load across multiple nodes.
Scale Up
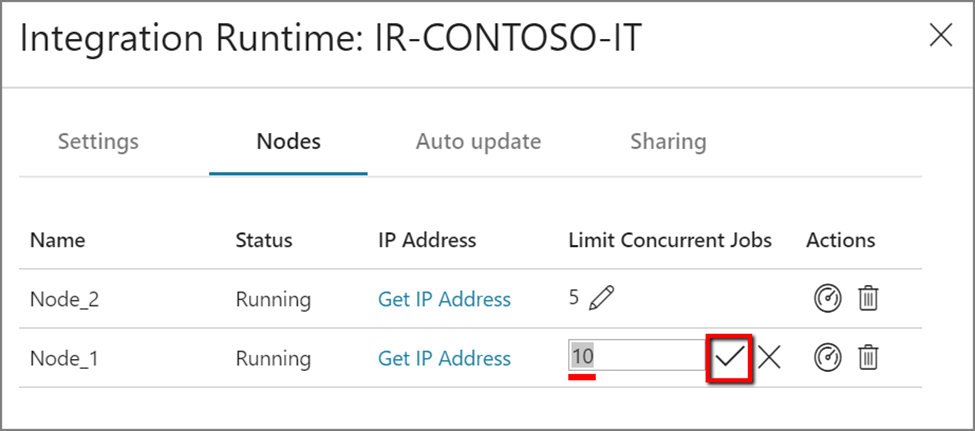
Per Microsoft documentation, “When the processor and available RAM aren’t well utilized, but the execution of concurrent jobs reaches a node’s limits, scale up by increasing the number of concurrent jobs that a node can run. You might also want to scale up when activities time out because the self-hosted IR is overloaded. As shown in the following image, admins can increase the maximum capacity for a node:”
So now that I knew my options for scaling the SHIR configuration, the next questions I had were:
- How will I best test the impact of changes to the SHIR infrastructure on pipeline performance?
- What measurements will I capture to determine “performance”
- And how will I work with my Infrastructure team to resize the SHIR configuration?
Testing Methodology Methods:
Now that I had identified the problem with my integrations and determined my options for fixing it, I knew I needed to put together some kind of optimization testing plan so we ensure that whatever scaling actions were taken against the SHIR were not too much, causing unnecessary cost, and were not too little putting us back at square 1. From what I saw, there were a few options of designs I could implement to test this:
Option 1: Standard Data Size Design Pattern
The first option for testing the integration gateway would be to create a standard data pull to ensure that each pull is the same each run as parameters are changed to the infrastructure behind the SHIR. The logical design using this method is outlined below:
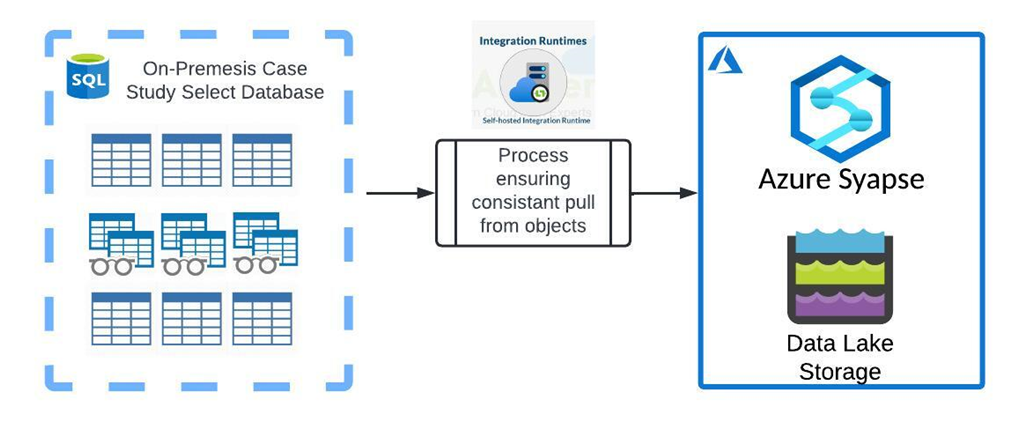
- The first step of this option would be to select a Database that can be used reliably to pull large data volume from that existing data pipelines have access to.
- Once the database has been selected, objects within that database will need to be identified as a good source of high-volume transactions that can provide reliably consistent pulls throughout the duration of the test. This can be a combination of views as well as tables, to ensure that there is good coverage for data requests that would come through in the future.
- A process would be defined to pull the same sample size each time from this list of objects. For example, a “Select Top 1,000,000 * From [table_schema].[table_name]” query can be passed across each object to ensure that there are controls in place for testing reconfigurations of the SHIR hardware.
- Finally, it may be appropriate to test data transfers to both synapse AND data lake to account for any differences in translating tabular data to flat files vs. table-to-table transfers.
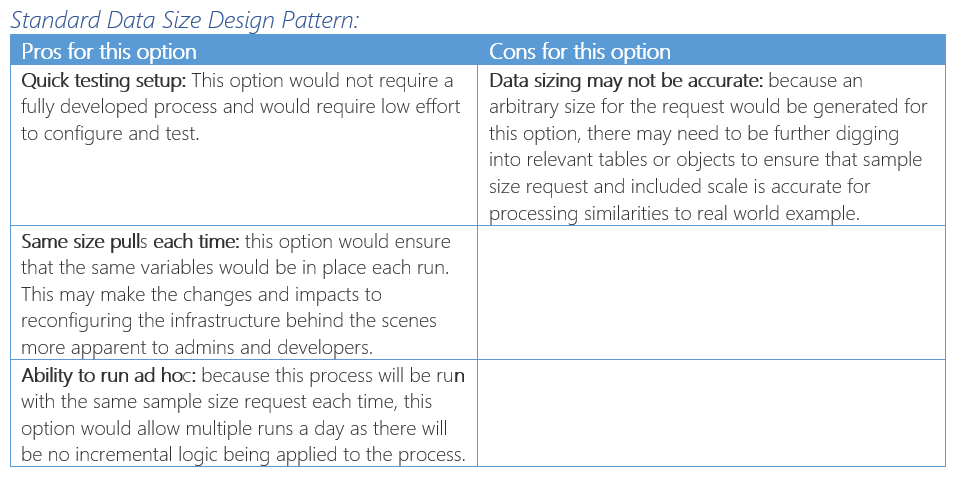
To aid my decision I developed a methodology Pro and Con List:
Option 2 Accurate Workload Design Pattern
The second methodology would aim to mimic the size of requested data along the lines of real-world data requests. This means that tables would have incremental requests passed along to them to better assess the sizing requirements for a given workload. This is outlined in greater detail in the logical design below:
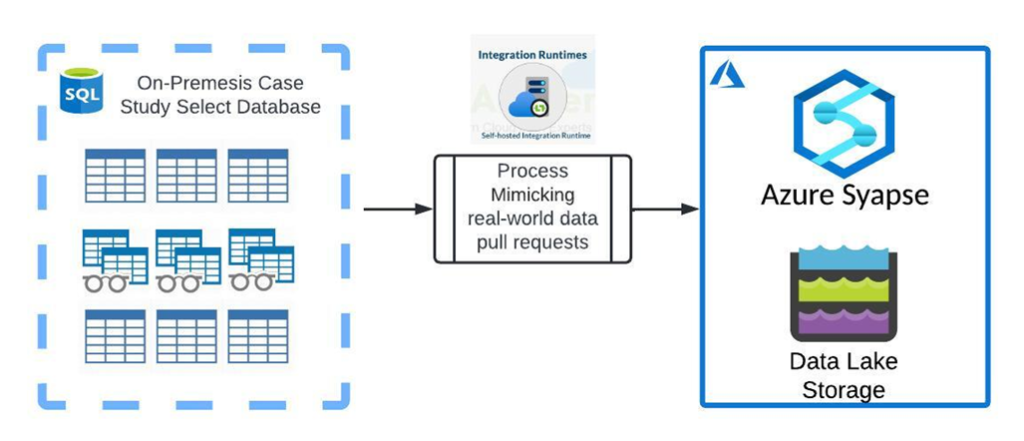
- The first step of this option would be to select a process that can be leveraged for accurate representation of existing and future data volume requirements for the SHIR configuration and admins to base sizing recommendations from.
- Tables isolated to the selected process will then be configured to pull accurate data sizes into the cloud based most likely on incremental pulls. This will create accurate data sizing based on requests that the system will likely see in the future.
- Finally, it may be appropriate to test data transfers to both synapse AND data lake to account for any differences in translating tabular data to flat files vs. table-to-table transfers.
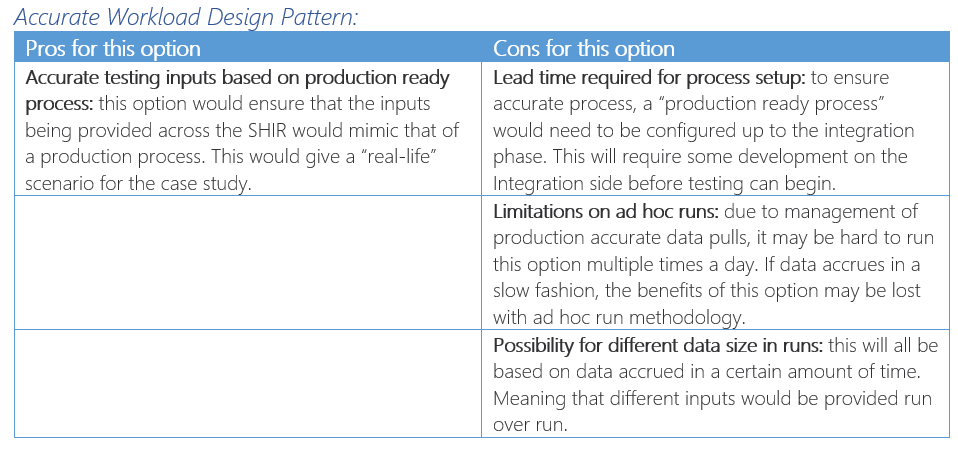
To aid my decision I developed a methodology Pro and Con List:
Selecting My Testing Methodology:
Based on the assessed Pros and Cons of the above methodologies, the recommendation I came up with alongside the Infrastructure team for testing was to go with the Standard Data Size Design Pattern method. Using this method our team would be able to achieve the following:
- Consistent sample size
- Results in more accurate tuning of infrastructure
- Simple code (no incremental pulls, no merge maintenance, etc.)
- Less lead time to start testing
- No finalized solutions needed
- Very minimal setup activities to run these pipelines
- Ad hoc run abilities
- More flexibility with developer schedules to preform tests
- Can run any time without built in incremental pulls for consistent tests
The downside of this option was stated to be the risk of unrealistic sample sizing based on these tests not being production pipelines. However, with some up-front analysis on throughput to the On-Premises database and digging on transactions accumulated within the projected export SLAs, testing teams should be able to get a sample data size very close to the volumes production pipelines will see.
Our specific test would be on a sample size of 50 tables, requesting 1 million records from each table in accordance with our Hourly incremental load process.
Measuring Performance Metrics for Tests
At this point I had come up with, what needs to be tested, how we were going to simulate consistent data throughput scenarios, but we had yet to come up with what our metrics were for performance. The team I worked with decided to divide performance metrics into two categories. Pipeline Performance and Infrastructure performance:
Data Integration Pipeline Performance Metrics:
Process Completion Time:
This metric will assess how long it took for the standard process to complete. Decrease in this metric will point to more optimal configuration, while up ticks in this metric will point to less optimal configuration.
Microsoft Performance Tuning Alerts:
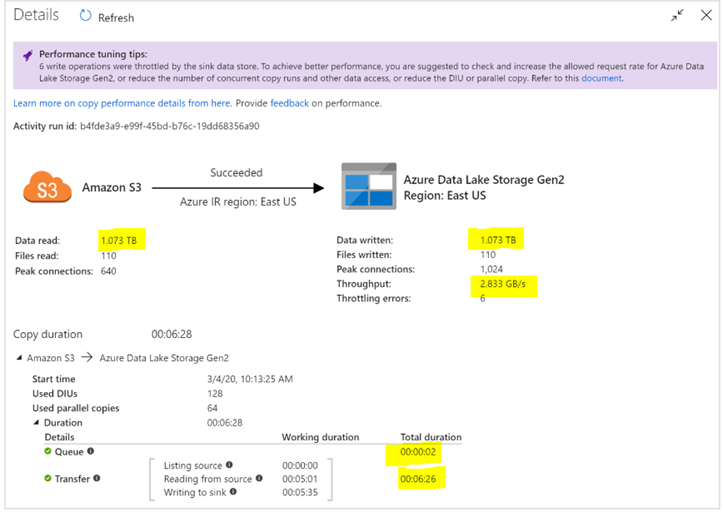
While processing, ADF and Synapse pipelines will often output performance tuning tips and or warnings based on the current or prior run. (Example Below):

For processing specific for the SHIR this is what developers and testers will be looking out for:
- “Queue” experienced long duration: it means the copy activity waits long in the queue until your Self-hosted IR has resource to execute. Check the IR capacity/usage, and scale up or out according to your workload.
- “Transfer – reading from source” experienced long working duration: SHIR machine may have latency connecting to source data store, not enough inbound bandwidth to read and transfer files efficiently, low CPU, throttling error, or high data store utilization, etc.
- “Transfer – writing to sink” experienced long working duration: SHIR machine may have latency connecting to sink data store, insufficient outbound bandwidth, low CPU, throttling error, etc.
Data Throughput Metrics:
Consolidated copy activity summary outlining queue and copy statistics. Changes to these metrics will be assessed to gauge performance of the controlled tests:
Comments on “Optimal SHIR Configuration” From the Data Integration Perspective:
An optimal configuration for the SHIR would leverage the metrics recorded in the section above aiming for the following outcomes:
- Lowest possible processing time given data volume.
- Low transfer runtime and over all processing time
- No Performance tuning alerts during run
- Low queue time
- Low transfer latency
- Highest possible throughput for selected data volume
Infrastructure Performance Metrics
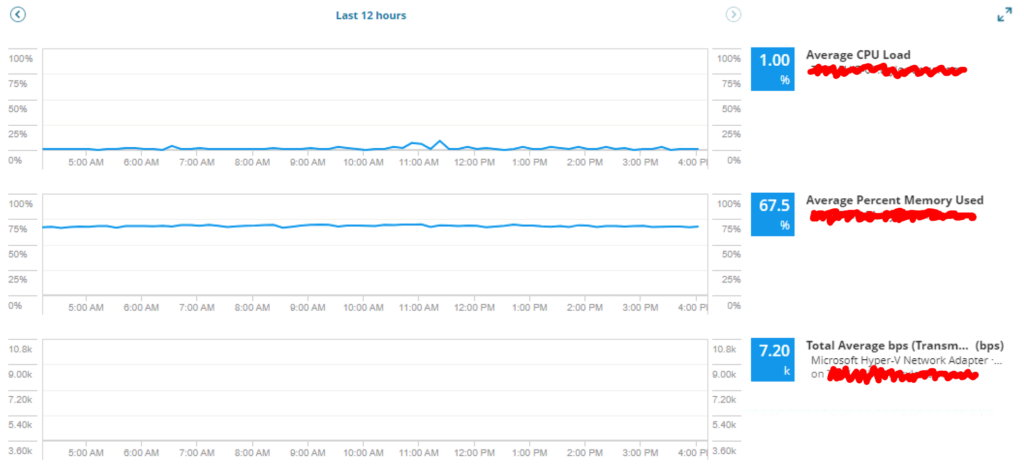
Average CPU Load
This metric will help to evaluate how changing the data size and/or parallel executions impacts CPU load and how CPU load may impact processing times.
Average Percent Memory Used
This metric will help to evaluate how changing the data size and/or parallel executions impacts Memory utilization and how Memory utilization may impact processing times.
Total Average BPS
This metric will help to evaluate how changing the data size and/or parallel executions impacts network utilization and how network utilization may impact processing times.
Comments on “Optimal SHIR Configuration” From the Infrastructure Perspective:
Optimal performance from the infrastructure side of these tests would weigh the resource allocation to the SHIR configuration against the business gain for faster data integration speeds. The optimal configuration would result in the Highest Pipeline performance with the lowest amount of resource allocation to host the SHIRs on the on-premises VMs.
Testing Cycle Outline
For the added benefit of you reading this, I have put together a quick flow diagram of how the testing cycle operated. White Activities indicate cross functional steps between the Infrastructure Team and Data Engineering Team, Purple Indicates Data Engineering Team, and Blue indicated Infrastructure Team:

Below is the specific configurations that were tested with a data load of 50 tables requesting 1 million records from each table:

Data Platform Integration Pipeline Performance:
The following was our performance of metrics outlined based on the testing cases for 50 tables requesting 1 million records from each where the top 5 average columns were assessed against the top 5 slowest iterations of loop logic generally pointing to larger sized files/tables:


Right off the bat I found it interesting just how much more performant my last run was when compared with my first. By going through this exercise we were able to see almost a 75% decrease in runtime!
Infrastructure Performance Findings
The following was our infrastructure performance of metrics outlined based on the testing cases for 50 tables requesting 1 million records from each:

Our Recommendations Based off of These Tests
After going through these tests, from a Data Platform side of house, we saw instant improvements of runtime. So the real question was what the Infrastructure team would come back with as far as recommendations are concerned. It is important to note that whatever configuration would be chosen would include 1 additional VM as a fall back in case one of our SHIR VMs went offline. That is why we only tested up to 3 total SHIR nodes.
Their Recommendations were as follows:

Based on the recommendation, we ended up going with the 3 Node, 4 CPU, 8GB RAM as it was the best of both worlds. We saw ~65% improvement in our pipeline processing and end up saving some costs when it came to memory. With the n+1 redundancy, we most likely would see further improvement from our tests so this felt like a good trade off.
Final Thoughts….
Through this post, I hope you are coming out with a better understanding of the SHIR infrastructure setup and how minimal changes to that setup can have a large impact on the throughput of your on-prem to cloud migrations. This outline of how we came up with measurable metrics, systematically tested our options, and in the end came to a conclusion that met the requirements of both teams is an example of looking at an issue and leveraging Microsoft Documentation to continuously tune your processing speeds. This is a great example of how to think about architecture at the bigger picture and collect metadata on process to communicate value added costs to cloud stakeholders. What do you think of this methodology? Is there anything you would have changed if you went through this scenario? Let me know! Thanks again for reading this week’s post!