
In the digital landscape of modern manufacturing, the heartbeat of efficiency lies in the Industrial Internet of Things (IIoT). The Industrial Internet of Things refers to a mesh of interconnected sensors, instruments, and machinery that have become an integral part of any Industrial Organization. Imagine a symphony of interconnected devices orchestrating the seamless production of goods, each IoT device playing a crucial role. Now, picture the potential disruption if one of these components falters unexpectedly causing production to grind to a halt. This down time and production results in delays for the production line which ultimately results in a monetary loss.
Industrial IoT isn’t just about connectivity; it’s a sentinel guarding against production hiccups. In this blog post, we delve into a compelling Proof of Concept my colleagues have developed in Microsoft Fabric, revealing the transformative power of predicting IoT device failure in manufacturing plants and real-time IoT Device Reporting. Join me in this deep dive where we demonstrate that proactive measures not only ensure uninterrupted production but redefine the very essence of industrial efficiency.
The Use Case
Firstly, I would love to shout out the team that was responsible for developing this use case: Craig Niemoeller, Lucas Orjales, Matthew Creason, Elizabeth Lau, and Mohammed Momin. If after reading this post, you feel as though your organization would benefit from a similar solution set, I encourage you to reach out to any of these folks for a follow up. Bonus points if you told them TDAD sent you 🙂
With Microsoft Fabric, It has never been easier to visualize and connect together all aspects of your Data Platform under one comprehensive toolset. Stream Analytics can be exposed directly to your Data Lake storage for fast acting data reads and writes, these data structures can then be readily accessed by the reporting suite (without data connection delays or complex integration workloads) for near real-time reads of data, and ML toolsets can be leveraged and mounted on top of the data collected from IIoT devices for an easily configured and comprehensive analysis of your data.
This is where the idea for the POC described today in this post came from. It has never been easier to tie together these components of data platform, so how can power of this platform be leveraged to directly showcase the Fabric’s proof of value in industry specific solution sets.
For Manufacturing, one of the largest data collection areas would be in IIoT Devices. Ensuring that these devices stay online and are operating at their desired parameters is critical to ensure that production continues uninterrupted and if something were to go wrong with a device, that floor managers and technicians are notified of the specific issue as early as possible so remediation can be proactive and not reactive.
By leveraging Stream Data Capture in Fabric, Paired with Real-Time Reporting, and Mounted ML Analysis of IIoT Data this team hoped it would be able to solve for this exact scenario: Collect IoT Component Data, Define Failure Ranges for those Components, Report on IoT Data in near real-time, and leverage machine learning to attempt to provide failure detection as soon as possible.
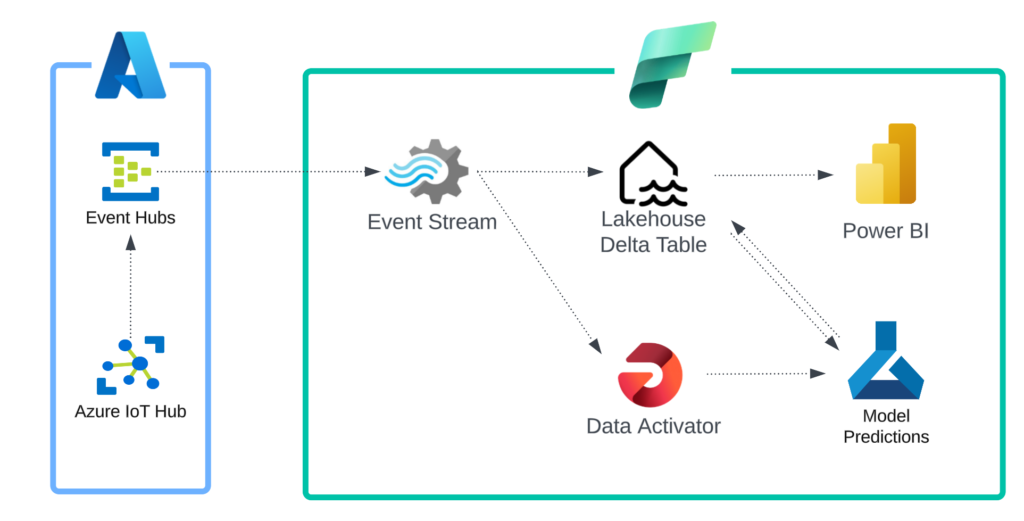
The Architecture
Azure IoT Hub
Azure’s IoT Hub enables a secure 2 way connection between IoT devices and applications built on top of the connections. This cloud-hosted solution allows for billions of devices to be registered for use by applications and data consumption pipelines.
In this particular solution, IoT hub would be leveraged to register devices that an organization would want to collect data from and leverage that data for analysis in Fabric.
It is important to note that the POC did not have access to an IoT device that fit the Manufacturing use case, so the team synthesized a device by leveraging a Python script to simulate IoT Data for this use case. By leveraging online data mock ups, the team leveraged a dataset that sent data every second around common machine KPIs such as Torque, Air Temperature, and Rotational Speed.
Event Hubs
Azure Event Hubs is a cloud native data streaming service that can stream millions of events per second, with low latency, from any source to any destination. This component of the architecture enables the streaming component of data sent from IoT devices for use in processing downstream.
This can basically be thought of as a translator between IoT events and Data to be stored in the Fabric Lakehouse and surfaced in reporting.
Event Stream
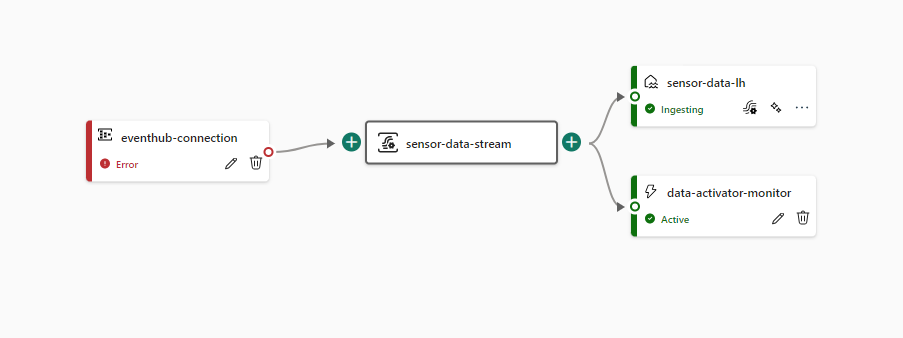
Event stream enables the conversion of IoT Data (sourced from the Event Hub) into usable data for Fabric tools. For example, the image above shows the event stream for this particular POC. The flow can be divided into 4 parts:
- Eventhub-connection: This step of the event stream enables the connection to the Event Hub endpoint which allows for IoT data to flow into the Event Stream work flow. This is where the connections are managed for the data that is needed for the workload.
- Sensor-Data-Stream: This is where the data format of the consumed data is specified to transform the event hub output into the data format of your choice. In this example the team specified the data being read as JSON and that was translated into a tabular data output to be stored in downstream data repositories:
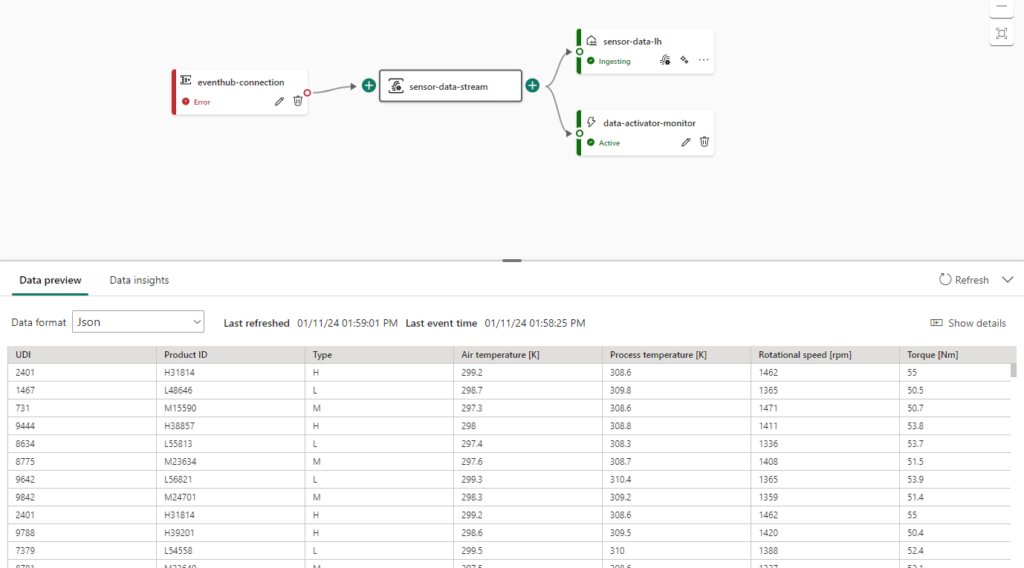
- Sensor-Data-LH: This is a sink activity in the Event Stream. It enables the data collected from the Event Hub to be converted from JSON and inserted into a Delta Table configured in the Lake House section of Microsoft Fabric.
- Data-Activator-Monitor: This is a sink activity in the Event Stream responsible for sending Data captured from the Event Hub to the Data Activator responsible for monitoring thresholds of failure for the data streamed from IoT Devices.
This drag and drop interface enables users to easily transfer stream data to many different areas of Fabric for analytical uses. All it takes is the setup of the Event Hub source and configuring data outputs and data will be actively collected from the IoT devices in question.
Lakehouse (Delta Table)
We covered the Lakehouse component of Fabric in one of the earlier blogs and the power of the Lakehouse is demonstrated here for this POC as well. By navigating to the Lakehouse Database, we can see that data is actively collected from the IoT devices and automatically stored in tables through our event stream:

That data can then be used for more generalized Analytical Querying or be leveraged as a data source for other reporting or machine learning needs:
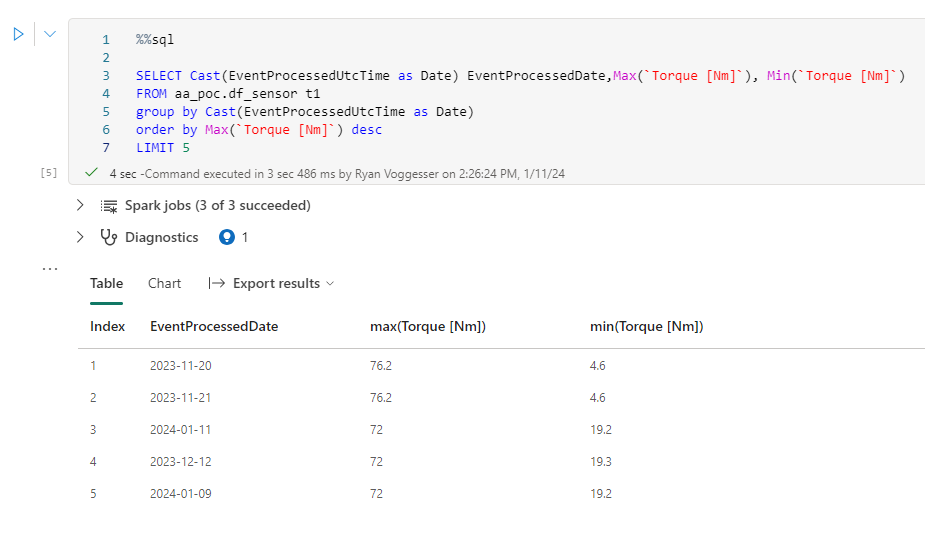
All of this is possible without ever storing this data in a logical SQL or NoSQL DB!
Data Activator
Data Activator is a new architecture component that we have not covered in one of my posts. Data Activator is a no-code experience in Microsoft Fabric for automatically taking actions when patterns or conditions are detected in changing data.
In the POC Use Case, this tool could be used to notify stakeholders if IoT device KPIs rise above or fall below a certain threshold. For Example on the Data Activator Reflex for this POC we see that there are two threshold rules defined and tracked for data being streamed from the IoT device:
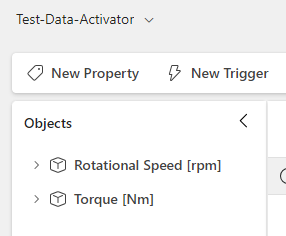
By clicking into the Rotational Speed [rpm] Object we see that there is a Trigger assigned to ensure that the RPMs do not dip below 1300 rotations per minute:

We can add additional criteria to this Reflex as the POC team did here by stating that we only want to alert if the RPMs stay below 1300 for over 1 minute and then we can specify an action such as a teams message or email to notify users that our rule has been broken:
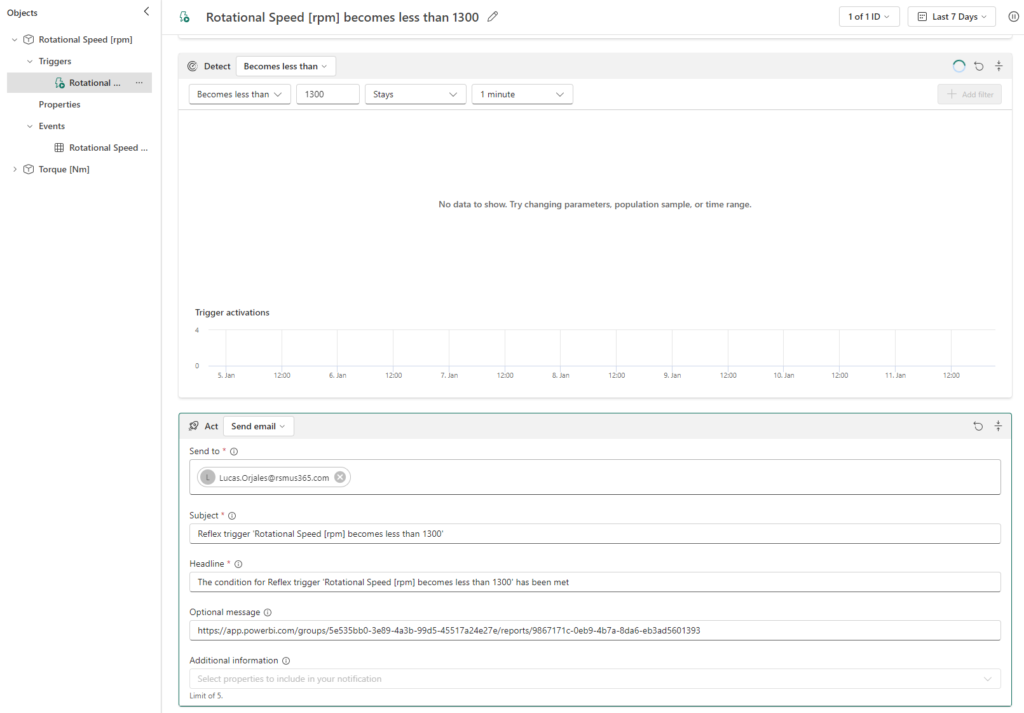
The Data Activator reflex will continuously monitor the data sent to it via the Event Stream to ensure that the appropriate people are notified if there are any anomalies in the Data.
Power BI
An added benefit of capturing live streaming data in a Lakehouse is we can build a simple Power BI report on top of the data being collected and provide “Real-Time” reporting metrics of the data being collected off of the IoT device.
The Report below is an example of data being consumed from the POC’s simulated IoT device allowing users to monitor the levels of the different KPIs:
Model Predictions
Now that we have explained the data collection and alert methodologies and how they work in the defined architecture, we can now discuss the Predictive Modeling component of the POC’s design.
In Fabric, there are a couple pieces of architecture that we should define before going into how we enable the solution set.
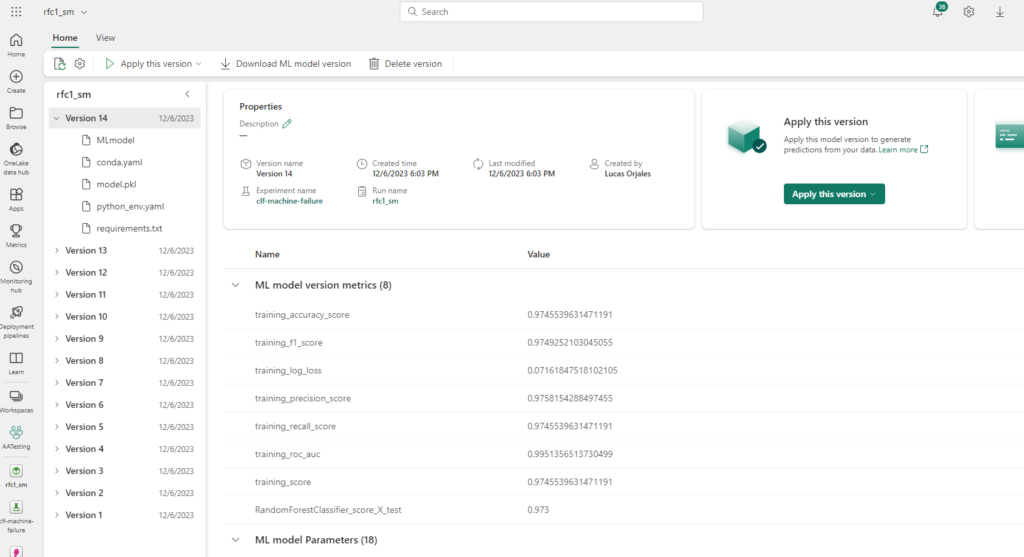
- ML Model: The ML Model component of the Fabric Workspace is where the actual code behind the predictive learning solution is stored. This is what we can reference in experiments and can version out over time based on feedback and performance of the predictive model:
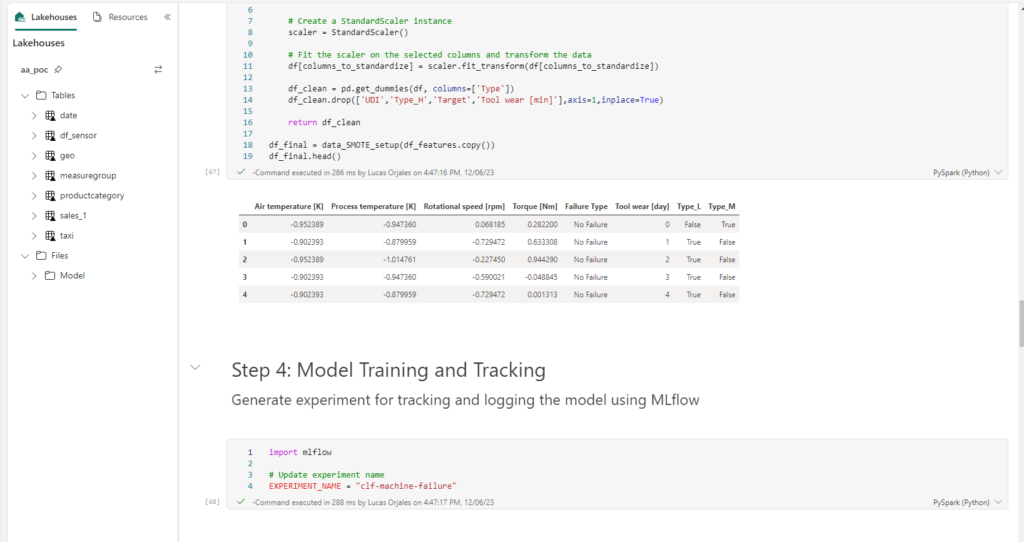
- The CLF Predict Machine Failure Script: This is essentially a Notebook where Data is loaded, Data Discovery is documented, Data Wrangling is preformed to prepare and cleanse the dataset, Categorical/Numerical/ and Target Attributes are defined, and Model Training and Tracking occurs.
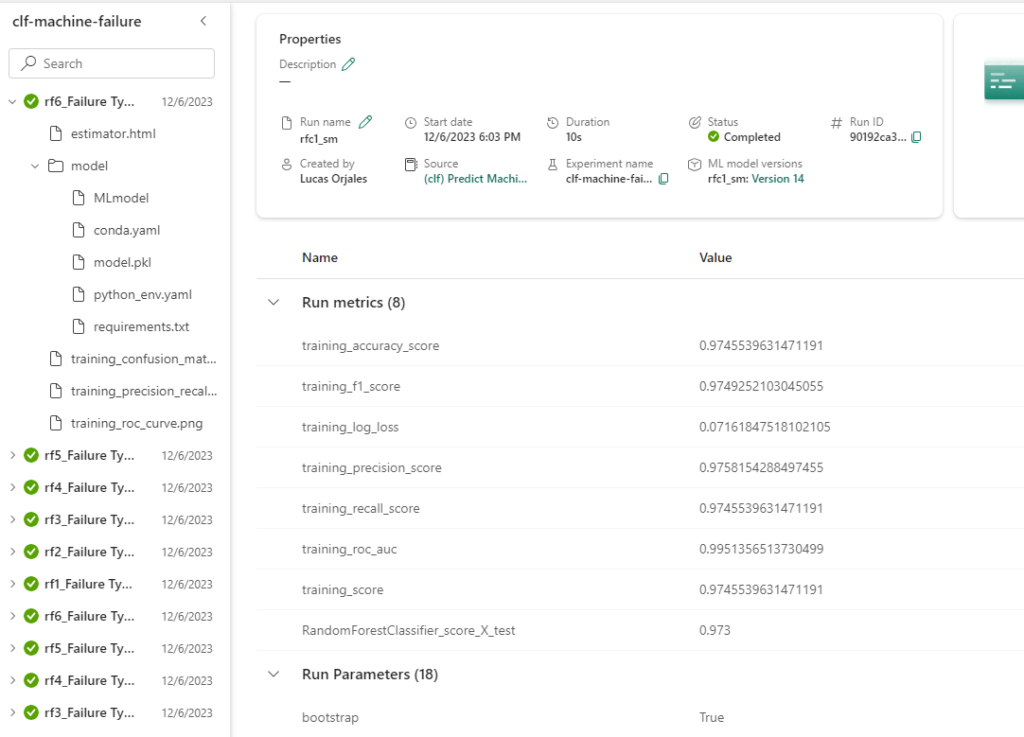
- Experiment: Where the model is actually applied against the datasets. This experiment leverages the CLF Predict Machine Failure script and applies it against data collected from IoT data in the Data Lakehouse. Here we can see how the model preformed and leverage what was learned to further tune the model for accuracy.
Final Thoughts
Connecting the dots in the world of data-driven innovation has never been more accessible, thanks to the seamless integration of powerful tools in Microsoft Fabric. In the showcased Proof of Concept, the team adeptly constructed an end-to-end platform that effortlessly captured streaming IoT device data, storing it in Microsoft Fabric’s Data Lakehouse. This process extended to vigilant monitoring, anomaly detection, and real-time alerting, culminating in the development of predictive models for early failure detection in IoT devices. Microsoft Fabric’s remarkable capabilities facilitated this solution, providing unparalleled cohesion among various tools through an intuitive “low-code” interface.
The collaborative design of these elements not only demonstrates the platform’s value proposition but also opens up a world of opportunities for innovative data solutions across diverse use cases.
I’d like to thank the team who championed this POC and allowed me to share their product. If you have any questions, comments, or just want to chat about this solution please don’t hesitate to reach out! Thanks for Reading!