Unraveling Microsoft Fabric: An Introduction to Fabric’s Data Engineering
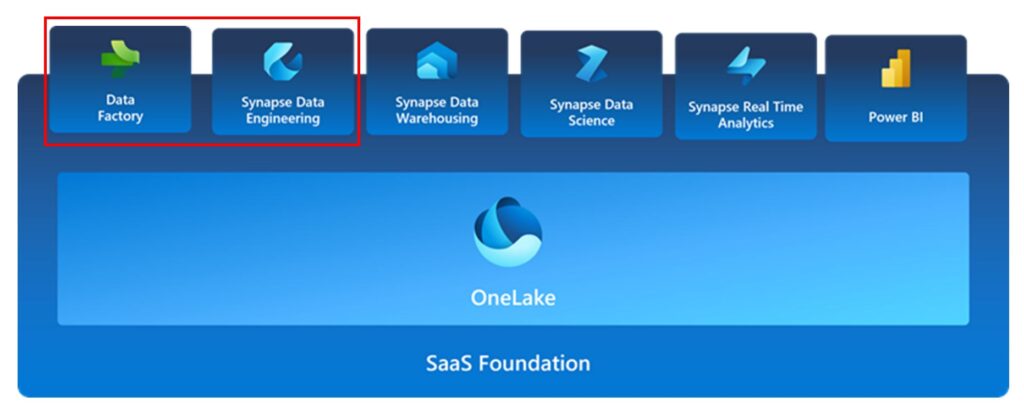
Today we are back at it again with Microsoft Fabric. In this blog post, I thought it would be nice to demonstrate the innerworkings of the Synapse Data Engineering service through the use of practical examples. What I will be attempting to do is load data into a Lakehouse in the Data Engineering section, develop a simple Python script to run some analysis on the Lakehouse data we pull in and show how we can orchestrate this workload in a Fabric Pipeline. This will act as a skeleton for future use cases you may work on in your own organization!
BEFORE WE DIVE IN….If you are new to this blog series – welcome! I would recommend that you pause here and catch up with the initial posts in this series if you want to understand some of the basic elements we have already covered. The following posts will be useful to fully understand what we will be covering here today:
- A Comprehensive Introduction to Microsoft Fabric
- Microsoft Fabric’s OneLake
- Microsoft Fabrics Data Factory
For those of you returning…WELCOME BACK! Let’s get started with a quick overview of the Microsoft Fabric Data Engineering section.
Fabric’s Data Engineering Service Overview
Microsoft Fabric’s Data Engineering service enables users to design, build and maintain infrastructures and systems that enable organizations to collect, store, process, and analyze large volumes of data. The primary elements found in this section include Lakehouses, Notebooks, Spark Job Definitions, and Data Pipelines.
- Lakehouse: Organization of structured and semi-structured data sources that can be accessed by analytical workloads such as SQL Queries, Reporting tools, etc. Think of this as a Data Warehouse built completely off of data lake storage.
- Notebooks: An interactive computing environment that allows users to create and share documents that contain live code, equations, visualizations, and narrative text. This is where Data Engineering processes are coded out with support for multiple languages powered by Spark.
- Spark Job Definitions: A set of instructions that define how to execute a job on a Spark cluster. This can Include information such as the input and output data sources, the transformations, and the configuration settings for the Spark application.
- Data Pipeline: a series of steps that can collect, process, and transform data from its raw form to a format that users can use for analysis and decision-making.
In the examples today, we will be leveraging the Lakehouse, Notebook, and Data Pipeline elements of the data engineering jobs.
Lakehouse Overview
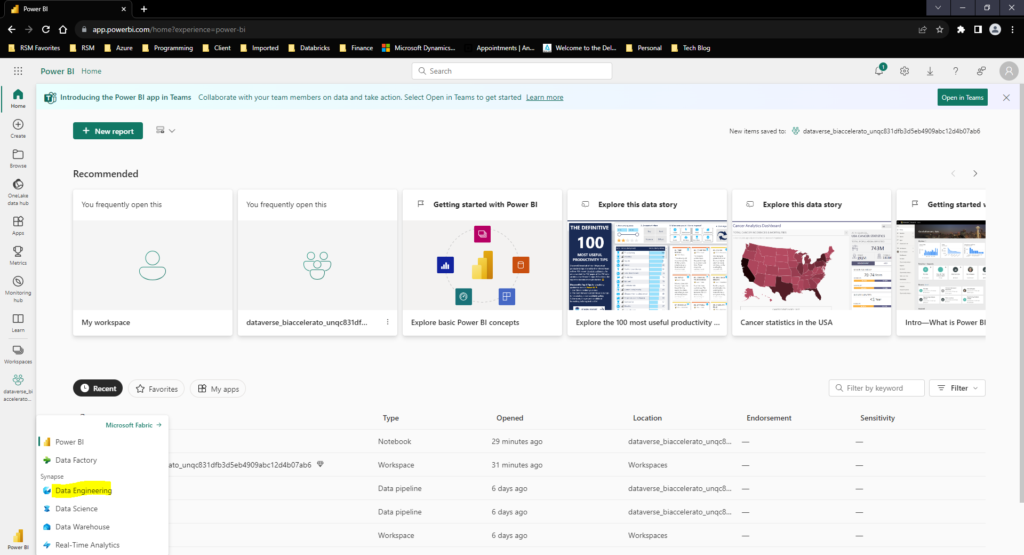
Jumping straight into Microsoft Fabric, we will start by navigating to the Data Engineering section:
Once there we will be brought to the Synapse Data Engineering homepage. Here we will see all of our recent assets in Fabric, but we will start off by opening a Lakehouse configuration
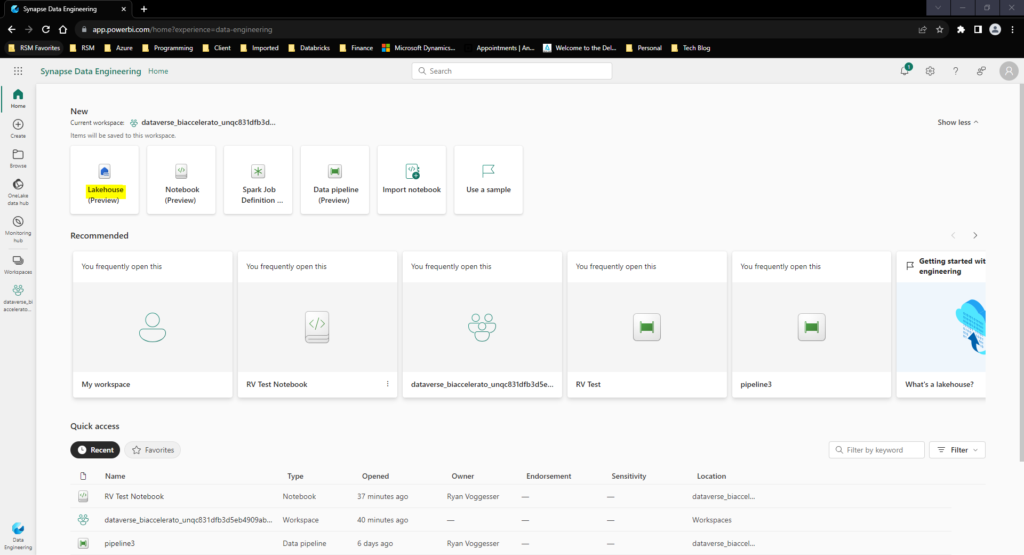
To Configure a Lakehouse all we need to do is provide a Name for our Lakehouse resource and hit create. Once we complete that step we are transported directly into our Lakehouse Landing Page:
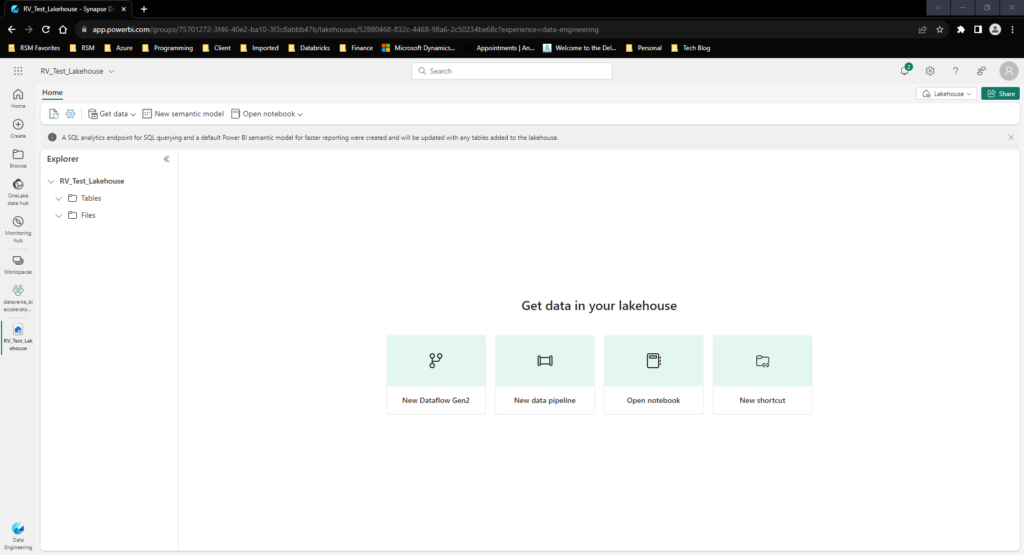
To start, lets get some data into our Lakehouse so we can begin working with it. By Selecting the “Get Data” tab in the top left corner we see that we have a couple options for sourcing data into our Lakehouse:
- Upload Files: This will allow us to upload data directly from our Local Machine to the Lakehouse.
- New Pipeline: This will enable us to leverage copy data activities to load data into the Lakehouse in a repeatable manner.
- New Dataflow Gen2: This will open up the power query editor that we discussed last week in the Microsoft Fabrics Data Factory post
- New Shortcut: This will allow you to connect to Microsoft Fabric’s OneLake for already shared data sources in Fabric OR connect to external ADLS or S3 storage options:
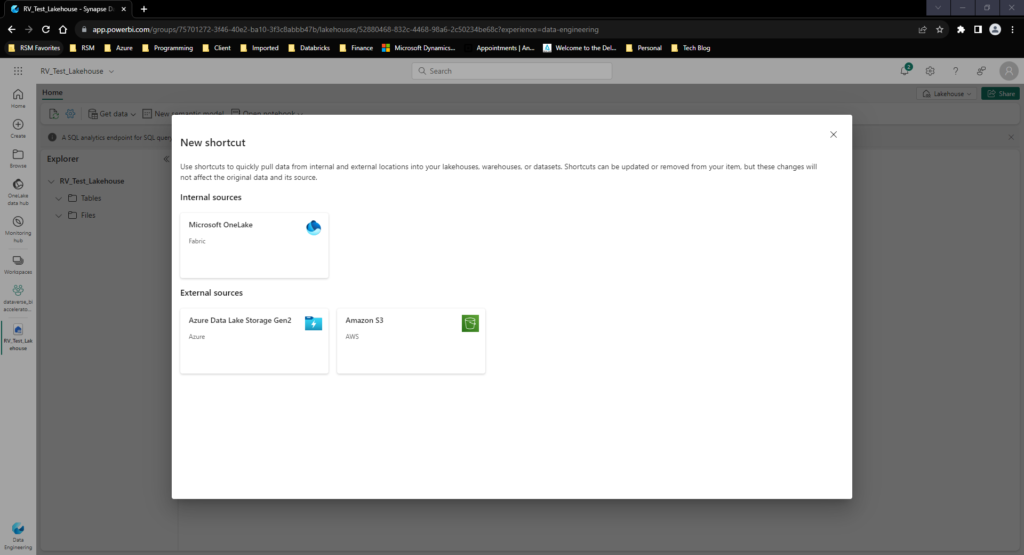
- New Event Stream: Finally, we have the option for creating a streaming source straight to your Lakehouse – this will require you to create an Event Stream in Fabric. We will put a hold on this topic until we get to the Streaming capabilities in Fabric in a future post.
For Simplicity sake, we will start by uploading a few CSV Files containing customer and sales data from our local machine leveraging the upload files option.
Once we Load data we see these appear as 2 CSV Files in our Lakehouse Files section:
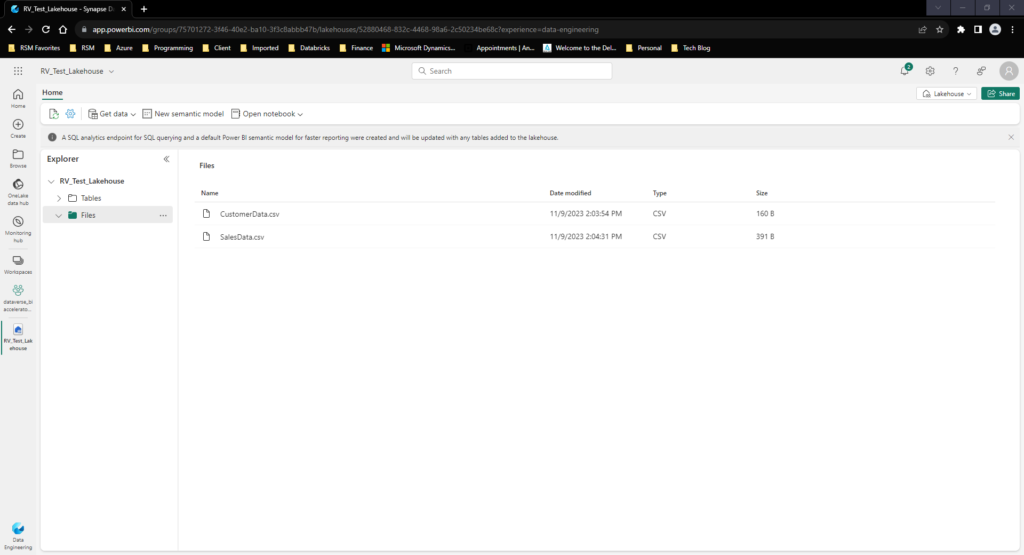
From here, we now have enough capabilities to create our first query using the data engineering capabilities in Microsoft Fabric!
Notebook Overview
Now that we have create a Lakehouse in Fabric, we have reached the point where we can get to the fun part – deriving insights! To start, we will begin in our Lakehouse Portal in Fabric with the open Notebook tab:
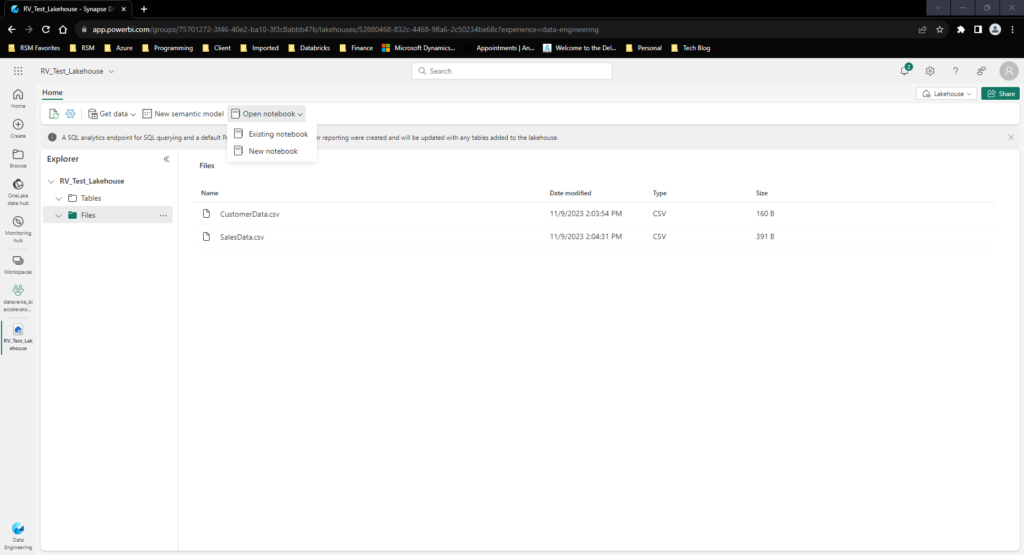
We have the option to create a new notebook or leverage one we have already created. For this purpose I will be creating a new notebook. By creating and giving a name to a notebook I am transported to a notebook editor window:
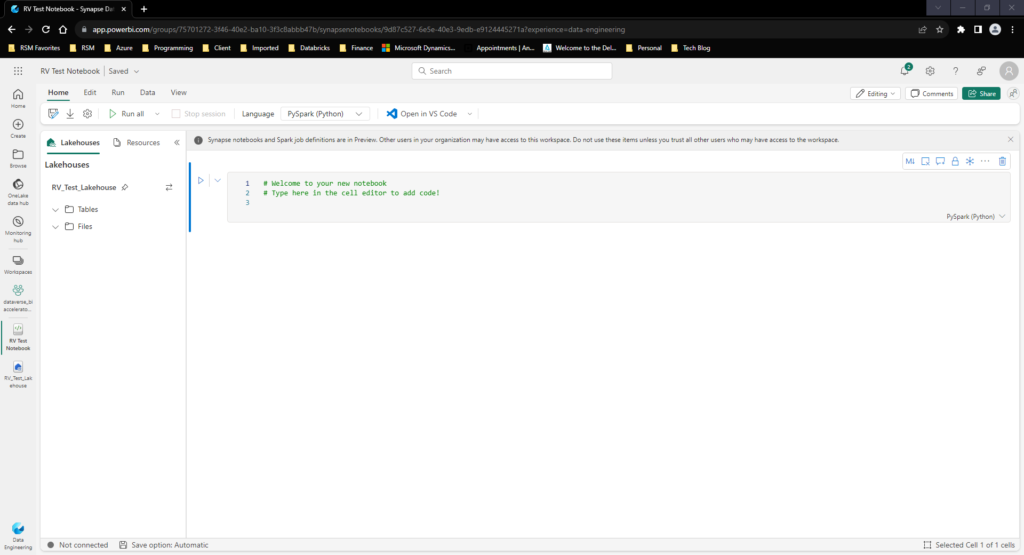
One cool thing about Fabric’s Notebook editor compared to Synapse is that the object explorer of your Lakehouse has drag and drop properties! Meaning I can take the predefined objects in my Lakehouse and drag them directly to the notebook to automatically create a data frame for further transformation:
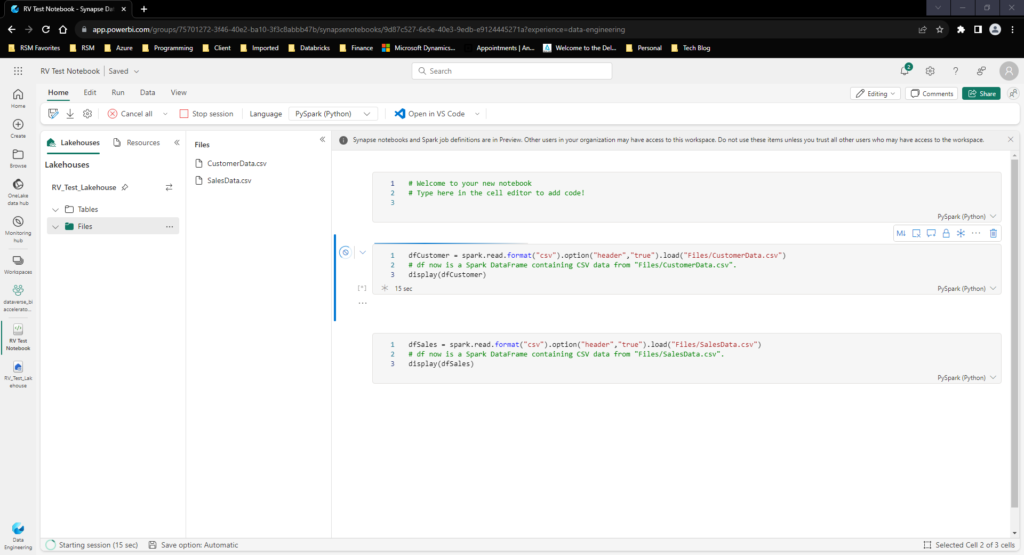
By leveraging the following code I am able to display Customer and Sales Data:
dfCustomer = spark.read.format("csv").option("header","true").load("Files/CustomerData.csv")
# df now is a Spark DataFrame containing CSV data from "Files/CustomerData.csv".
#display(dfCustomer)

dfSales = spark.read.format("csv").option("header","true").load("Files/SalesData.csv")
# df now is a Spark DataFrame containing CSV data from "Files/SalesData.csv".
#display(dfSales)

dfCustomer.createOrReplaceTempView("Customer")
dfSales.createOrReplaceTempView("Sales")

%%sql

SELECT * from Customer --select * from Sales
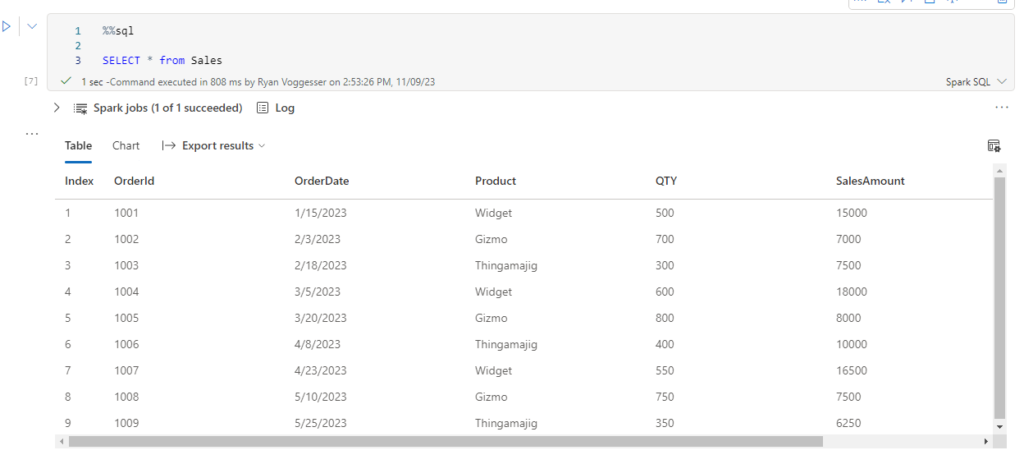
Now let’s do some analysis – let’s summarize this data by customer for total sales:

Now that we have created a summary output based on the raw data let’s see if we can write this back to the Lake Database as an object. With the following code let’s create a Transformed File in Fabric:
SqlQuery = """

SELECT s.CustomerId, c.CustomerName, sum(s.SalesAmount) as TotalSales
from Sales s
left join Customer c on s.CustomerId = c.CustomerId
group by s.CustomerId, c.CustomerName

"""

dfSummarizedSales = spark.sql(SqlQuery)

dfSummarizedSales.write.mode("overwrite").format("csv").option("header","true").save("Files/SummarizedSales.csv")

df = spark.read.format("csv").option("header","true").load("Files/SummarizedSales.csv")
# df now is a Spark DataFrame containing CSV data from "Files/SummarizedSales.csv".
display(df)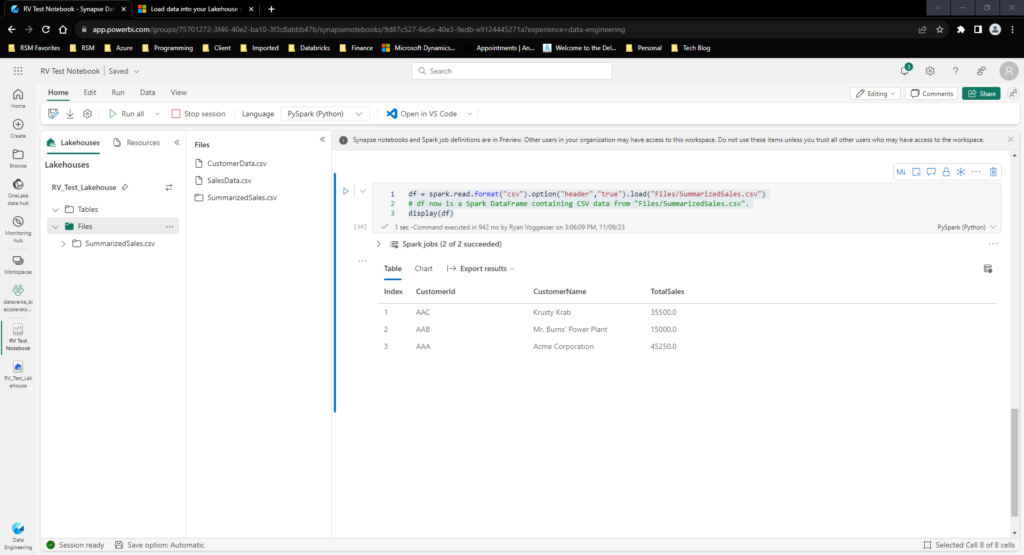
Being a developer in Synapse from a Spark Notebook perspective, the biggest upside I see here is how easy the interface is to work in. There is no need to juggle ADLS access and connection strings.
Data Pipelines
Now that we have sourced data into the Data Engineering section of Microsoft Fabric – how do we make this repeatable? In the following example I will be attempting to add some sales data to my SalesData.csv and demonstrate how orchestration works in the Data Engineering section of Fabric.
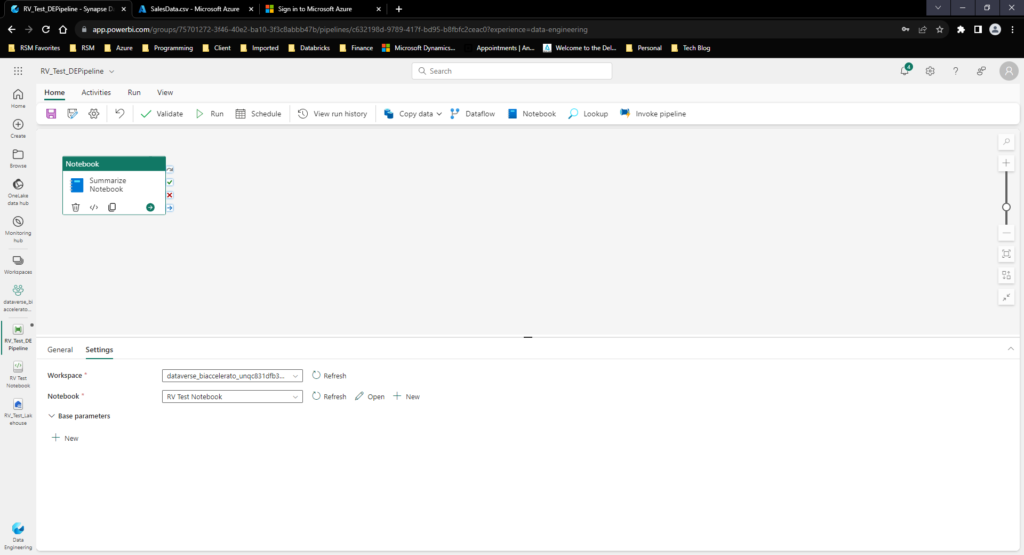
Going back to the homepage of the Data Engineering Service, I created a new pipeline within the DE Service. This is basically identical to the pipelines we covered last week in the Microsoft Fabrics Data Factory post:
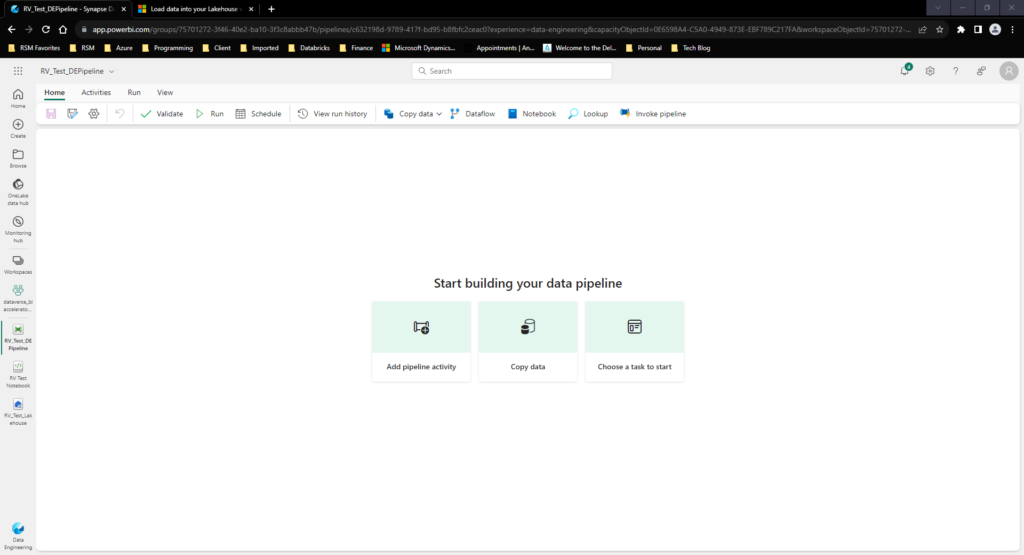
The first step is creating some kind of changed data input. For this example I have created a new Sales record in our Sales data loaded into the notebook section below:

I have uploaded the new sales Data into the Lakehouse files section manually:
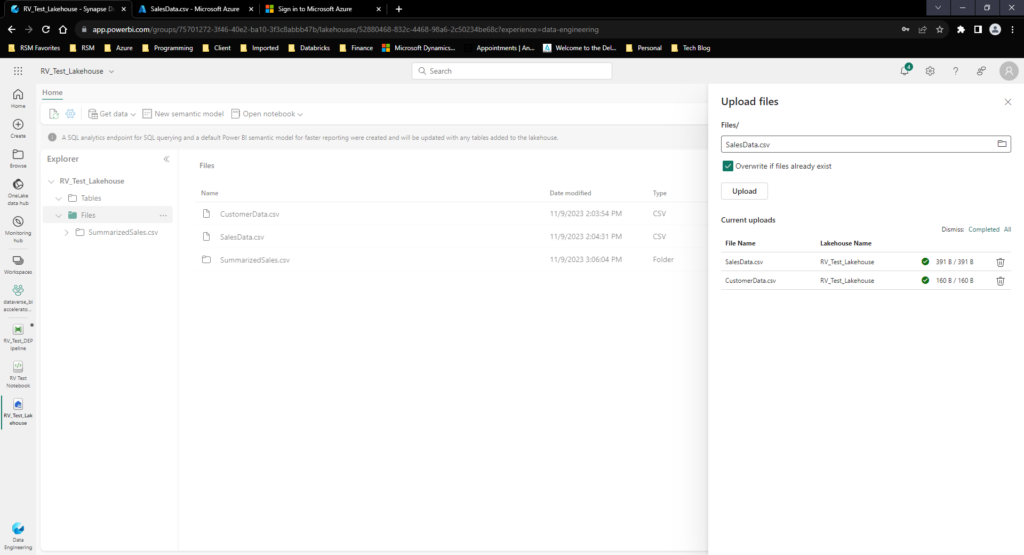
Now that I have uploaded the new data let’s run create a pipeline to process this data into a new version of the summarized sales extract:
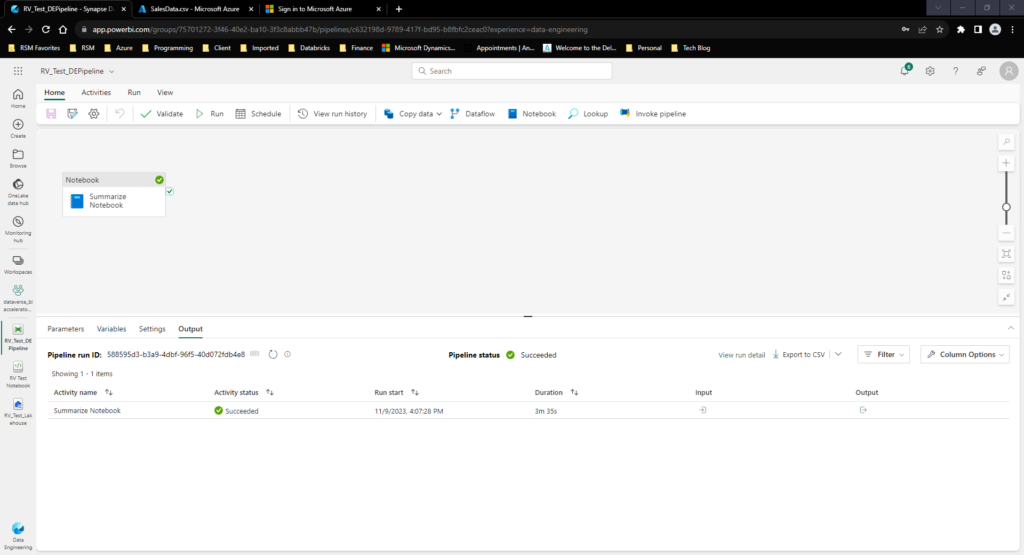
Once the pipeline is run, we see the values adjust given the new extract:
Original Extract Sales Summary:

Pipeline Run:
Final Extract Sales Summary:

This demonstrates how transformations can be automated and scheduled from directly in the Data Engineering portal for use by downstream AI/ML as well as reporting!
Final Thoughts…
Today we covered the Data Engineering service end to end. From Lakehouse, to notebook, to Data Pipelines I will say that this was fairly easy to work in compared to what we have seen in Azure Synapse. Thanks for reading the post this week! If there are any questions or additional insights you are looking for in regards to Fabric content, don’t hesitate to reach out!